CellMek SPS System: Sample Preparation Performance
Percent gated populations from automated versus manual sample preparations using a wash/stain/lyse & fix/wash workflow with a 10-color antibody panel in liquid or dry format
Kelly Andrews, Gang Xu, Xizi Dai, Karen Lo, Jessica Ashbaugh, Jin Zhang, Ernesto StaroswieckiResearch and Development, Beckman Coulter Life Sciences, Miami, FL United States
Workflow
Sample Preparation


Introduction
The CellMek SPS Instrument is an automated sample preparation system intended for in vitro diagnostic use in flow cytometry laboratories designed to process whole blood (WB), bone marrow (BM), and other relevant single-cell specimens for downstream flow cytometry analysis.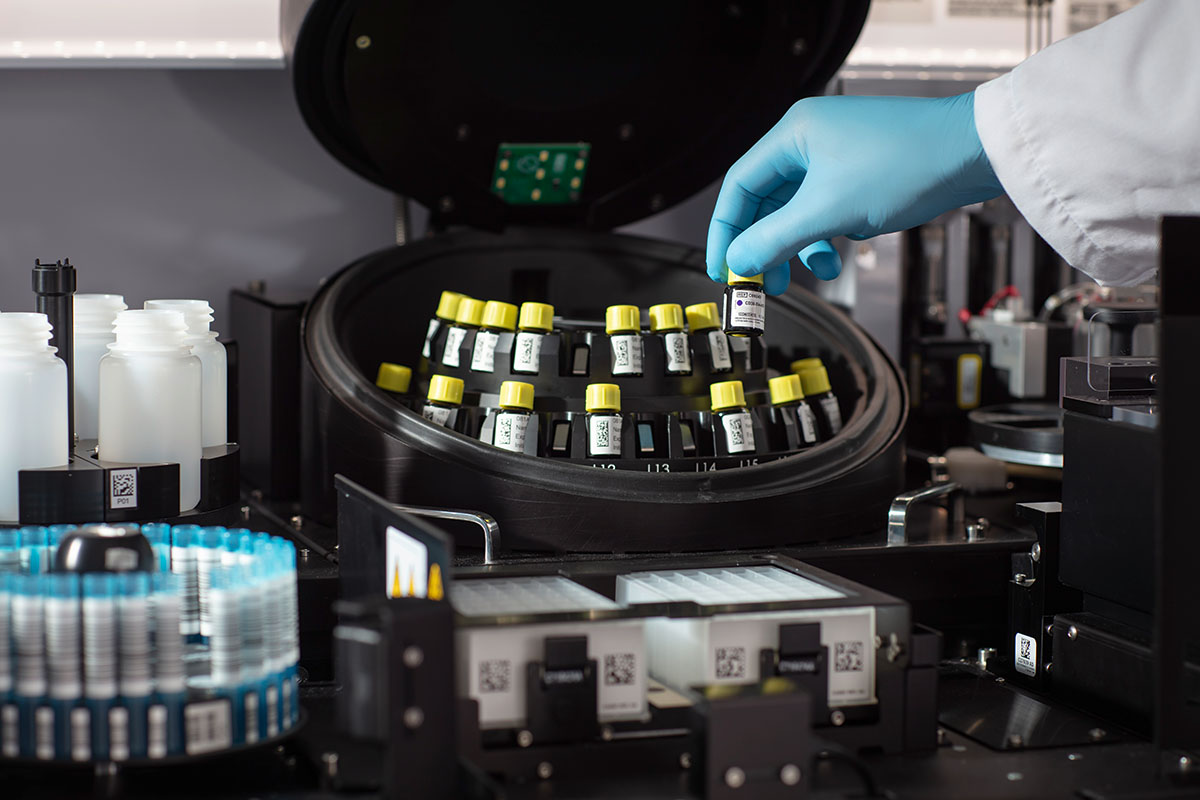
Clinical workflows commonly consist of washing a specimen aliquot, staining with liquid or dry antibodies, lysing red blood cells and fixing stained white blood cells (WBC), washing lysed/fixed prepared sample, and reconstituting in buffer for downstream flow cytometry analysis. A workflow such as this, which utilizes all modules of the CellMek SPS instrument, was chosen to assess system performance compared to manually prepared samples. Modules used include the sample transport module, reaction plate module, the cell wash module, the dry reagent module, the liquid antibody module, the prep reagent module, and the output module.
Methods
WB, BM, and other single-cell suspensions (cerebral spinal fluid [CSF] or other body fluid) were obtained from normal and clinical donors (97 unique donors) and were processed using a representative wash/stain/lyse & fix/wash workflow with a custom 10-color antibody panel in either dry DURACartridge format or liquid cocktail format. The 10-color panel consisted of Kappa-FITC, Lambda-PE, CD10-ECD, CD5-PC5.5, CD200-PC7, CD34-APC, CD38-AA700, CD20-AA750, CD19-PB, and CD45-KrO.
Table 1. Custom 10-color antibody panel in liquid or DURACartridge dry reagent format.
| Antibody Panel | Marker and Fluorochrome Combination (Liquid or DURACartridge Format) | |||||||||
| FITC | PE | ECD | PC5.5 | PC7 | APC | AA700 | AA750 | PB | KrO | |
| 10-Color Panel |
Kappa | Lambda | CD10 | CD5 | CD200 | CD34 | CD38 | CD20 | CD19 | CD45 |
Samples were prepared in duplicate on one of three CellMek SPS instruments, totaling 152 datapoints each for CD45+ WBC and gated sub-populations (liquid and dry pooled). Each sample processed with the CellMek SPS instrument was compared to a manually prepared matched-donor sample using equivalent workflow and reagents. All prepared sample data were acquired on a Navios flow cytometer and analyzed using Kaluza C software. Measurement Procedure Comparison and Bias Estimation was performed by biostatisticians.
Results

Figure 1. Representative overlay of dot plots from samples prepared automated with the CellMek SPS System (shown in green) or manually (shown in red). Dot sizes of Kappa/Lambda plots have been enlarged for better visualization. Plots are for illustrative purposes only.
Table 2. Clinical Donor
Specimens from patients having or suspected of having hematolymphoid malignancies; designated as abnormal by pathologist. These are obtained as spent samples from hospitals/clinics.
(Click on the population to see the Regression Plot)
| Population | N | Manual Sample Preparation | Automated Sample Preparation | Difference | 95% Confidence Limits | |||||
| Mean | Min | Max | Mean | Min | Max | Lower | Upper | |||
| Lymphocytes | 67 | 29.08 | 5.35 | 80.16 | 27.49 | 5.83 | 75.83 | -1.58 | -1.99 | -1.17 |
| Monocytes | 67 | 7.42 | 0.72 | 25.29 | 8.24 | 0.77 | 26.60 | 0.82 | 0.60 | 1.05 |
| Granulocytes | 67 | 61.71 | 7.28 | 88.61 | 62.06 | 6.53 | 87.80 | 0.35 | -0.06 | 0.77 |
| CD10+ | 67 | 59.86 | 3.50 | 87.65 | 60.16 | 4.47 | 87.69 | 0.30 | -0.11 | 0.71 |
| CD34+ | 67 | 1.60 | 0.01 | 95.10 | 1.61 | 0.01 | 94.93 | 0.00 | -0.02 | 0.02 |
| CD200+CD19+(Ly) | 67 | 9.89 | 0.22 | 22.45 | 10.69 | 0.01 | 23.35 | 0.80 | 0.60 | 1.00 |
| CD38+ | 67 | 7.20 | 2.60 | 24.34 | 8.08 | 1.28 | 24.73 | 0.88 | 0.66 | 1.10 |
| CD20+CD200+(Ly) | 67 | 9.62 | 0.24 | 22.77 | 10.42 | 0.00 | 23.29 | 0.80 | 0.61 | 0.99 |
| CD5+CD19-(Ly) | 67 | 70.85 | 8.60 | 88.49 | 70.53 | 8.97 | 88.42 | -0.32 | -0.54 | -0.10 |
| CD19+CD20+ | 67 | 12.99 | 0.22 | 27.30 | 13.24 | 0.00 | 27.33 | 0.26 | 0.06 | 0.46 |
| Kappa+(CD19+CD20+) | 66 | 59.26 | 42.32 | 71.25 | 59.23 | 42.17 | 72.60 | -0.03 | -0.40 | 0.35 |
| Lambda+(CD19+CD20+) | 66 | 40.04 | 27.35 | 57.26 | 40.03 | 26.60 | 57.40 | -0.00 | -0.39 | 0.38 |
Table 3. Clinical Donor
Specimens from patients having or suspected of having hematolymphoid malignancies; designated as abnormal by pathologist. These are obtained as spent samples from hospitals/clinics.
(Click on the population to see the Regression Plot)
| Population | N | Manual Sample Preparation | Automated Sample Preparation | Difference | 95% Confidence Limits | |||||
| Mean | Min | Max | Mean | Min | Max | Lower | Upper | |||
| Lymphocytes | 31 | 17.55 | 3.03 | 54.91 | 17.69 | 2.83 | 50.76 | -0.15 | -0.37 | 0.66 |
| Monocytes | 31 | 10.47 | 1.45 | 89.78 | 10.97 | 1.61 | 88.52 | 0.51 | 0.18 | 0.83 |
| Granulocytes | 31 | 65.33 | 1.89 | 87.99 | 64.46 | 1.04 | 85.86 | -0.87 | -1.47 | -0.28 |
| CD10+ | 31 | 35.84 | 1.30 | 81.81 | 37.53 | 1.52 | 83.00 | 1.69 | 1.06 | 2.33 |
| CD34+ | 31 | 4.19 | 0.02 | 54.05 | 4.29 | 0.02 | 53.83 | 0.10 | -0.05 | 0.25 |
| CD200+CD19+(Ly) | 31 | 10.23 | 0.03 | 28.75 | 11.29 | 0.02 | 34.20 | 1.06 | 0.47 | 1.65 |
| CD38+ | 31 | 11.51 | 1.21 | 91.00 | 12.12 | 1.26 | 89.06 | 0.61 | 0.22 | 0.99 |
| CD20+CD200+(Ly) | 31 | 9.80 | 0.02 | 26.28 | 10.95 | 0.02 | 32.28 | 1.15 | 0.48 | 1.82 |
| CD5+CD19-(Ly) | 31 | 70.85 | 48.06 | 87.44 | 69.17 | 46.31 | 87.38 | -1.67 | -2.40 | -0.95 |
| CD19+CD20+ | 31 | 11.42 | 0.07 | 30.65 | 12.12 | 0.06 | 35.77 | 0.70 | 0.11 | 1.28 |
| Kappa+(CD19+CD20+) | 29 | 59.80 | 42.21 | 88.97 | 60.30 | 45.73 | 86.74 | 0.50 | -0.49 | 1.48 |
| Lambda+(CD19+CD20+) | 29 | 37.40 | 11.12 | 47.01 | 37.41 | 13.20 | 47.59 | 0.01 | -1.02 | 1.05 |
The expected results for total bias from reference of percent positive:
- ± 5% point difference for % positive subsets ≤ 20%
- ± 8% point difference for % positive subsets > 20%
Table 4. Subcomponent bias from manually prepared reference of percent positive gated sub-populations at percentiles.
| Sub- component |
Group | Percentile | Level | Bias | 95% Confidence Limits | Acceptance Limit (±) |
Conclusion | |
| Lower | Upper | |||||||
| Sample Preparation Panel Design |
Typical Incubation |
25 | 5.895 | 0.493 | 0.380 | 0.606 | 5 | Pass |
| 50 | 20.263 | 0.349 | 0.216 | 0.483 | 8 | Pass | ||
| 75 | 56.340 | -0.012 | -0.294 | 0.269 | 8 | Pass | ||
| Throughput Optimized |
25 | 6.605 | 0.493 | 0.300 | 0.687 | 5 | Pass | |
| 50 | 25.505 | 0.176 | -0.030 | 0.381 | 8 | Pass | ||
| 75 | 58.765 | -0.384 | -0.713 | -0.054 | 8 | Pass | ||
| Instrument | 1 | 25 | 5.740 | 0.593 | 0.471 | 0.714 | 5 | Pass |
| 50 | 20.740 | 0.323 | 0.201 | 0.446 | 8 | Pass | ||
| 75 | 57.820 | -0.342 | -0.550 | -0.135 | 8 | Pass | ||
| 2 | 25 | 7.280 | 0.259 | 0.062 | 0.456 | 5 | Pass | |
| 50 | 27.240 | 0.322 | -0.062 | 0.707 | 8 | Pass | ||
| 75 | 54.820 | 0.410 | -0.345 | 1.164 | 8 | Pass | ||
| 3 | 25 | 7.445 | 0.280 | -0.011 | 0.571 | 5 | Pass | |
| 50 | 18.920 | 0.233 | -0.022 | 0.488 | 5 | Pass | ||
| 75 | 58.370 | 0.072 | -0.346 | 0.491 | 8 | Pass | ||
| Antibody Format |
Dry | 25 | 6.238 | 0.387 | 0.272 | 0.502 | 5 | Pass |
| 50 | 21.193 | 0.228 | 0.083 | 0.373 | 8 | Pass | ||
| 75 | 57.135 | -0.154 | -0.459 | 0.151 | 8 | Pass | ||
| Liquid | 25 | 5.850 | 0.703 | 0.519 | 0.886 | 5 | Pass | |
| 50 | 22.480 | 0.444 | 0.277 | 0.610 | 8 | Pass | ||
| 75 | 58.295 | -0.113 | -0.366 | 0.140 | 8 | Pass | ||
| Anti- coagulant |
ACD | 25 | 6.230 | 0.491 | 0.377 | 0.606 | 5 | Pass |
| 50 | 22.710 | 0.317 | 0.204 | 0.429 | 8 | Pass | ||
| 75 | 57.475 | -0.052 | -0.246 | 0.142 | 8 | Pass | ||
| EDTA | 25 | 7.565 | 0.523 | 0.416 | 0.631 | 5 | Pass | |
| 50 | 25.138 | 0.250 | 0.154 | 0.345 | 8 | Pass | ||
| 75 | 58.345 | -0.268 | -0.427 | -0.109 | 8 | Pass | ||
| Heparin | 25 | 6.855 | 0.130 | -0.045 | 0.304 | 5 | Pass | |
| 50 | 33.395 | 0.186 | -0.002 | 0.374 | 8 | Pass | ||
| 75 | 56.605 | 0.236 | -0.060 | 0.531 | 8 | Pass | ||
| None | 25 | 2.460 | 0.783 | 0.292 | 1.275 | 5 | Pass | |
| 50 | 12.208 | 0.537 | -0.056 | 1.130 | 5 | Pass | ||
| 75 | 50.065 | -0.419 | -1.758 | 0.919 | 8 | Pass | ||
| Specimen Type | BM | 25 | 5.255 | 0.682 | 0.516 | 0.849 | 5 | Pass |
| 50 | 20.280 | 0.423 | 0.255 | 0.592 | 8 | Pass | ||
| 75 | 55.660 | -0.187 | -0.498 | 0.124 | 8 | Pass | ||
| Body Fluid | 25 | 2.213 | 0.933 | 0.390 | 1.476 | 5 | Pass | |
| 50 | 10.648 | 0.699 | 0.040 | 1.357 | 5 | Pass | ||
| 75 | 48.283 | -0.347 | -1.932 | 1.237 | 8 | Pass | ||
| CSF | 25 | 4.140 | 0.010 | -1.006 | 1.026 | 5 | Pass | |
| 50 | 14.973 | -0.130 | -1.038 | 0.778 | 5 | Pass | ||
| 75 | 67.520 | -0.812 | -2.701 | 1.077 | 8 | Pass | ||
| WB | 25 | 7.390 | 0.347 | 0.266 | 0.428 | 5 | Pass | |
| 50 | 28.270 | 0.195 | 0.118 | 0.272 | 8 | Pass | ||
| 75 | 58.055 | -0.022 | -0.145 | 0.102 | 8 | Pass | ||
Conclusion
There is equivalent sample preparation performance between the automated CellMek SPS and manual preparation process irrespective of common sources of variability. Total bias from manually prepared reference of percent positive gated sub-populations was within 5 percentage points for populations ≤ 20% and within 8 percentage points for populations > 20%. Sub-component analysis of sample preparation panel design (typical incubation or throughput optimized), instrument (1, 2, or 3), antibody format (liquid or dry), anticoagulant (EDTA, ACD, Heparin, or none), and specimen type (WB, BM, body fluid, or CSF) was assessed on a pooled marker dataset. All sub-component categories analyzed were within 5 percentage points for populations ≤ 20% and within 8 percentage points for populations > 20%.
