Short Course
Basic Concepts in Particle Characterization
Particles
What is a particle? According to Webster’s Dictionary,a particle is “a minute quantity or fragment” or “a relatively small or the smallest discrete portion or amount of something.” Because the word “small” is relative to“something,” a particle can be as small as a quark or as large as the sun. In the vast universe, the sun is just a small particle! Thus, the range of sciences and technologies for studying particles can be as broad as we can imagine, from astrophysics to nuclear physics.Therefore, we have to define the type of particles in which we are interested.
“Fine Particles” is a term normally reserved for particles ranging from a few nanometers to a few millimeters in diameter. Particles may exist in various different forms.These forms span biological macromolecules and polymers—which can exist as linear chains and networks,including proteins, hydrogels, DNA chains, latexes, etc.Particles can also include ensembles of small inorganic,metallic, or organic molecules—or in some cases, even pieces of empty space such as microbubbles. The most common form of particles, however, are miniscule pieces of bulk materials, such as metal oxides, sugar,pharmaceutical powders, paint, or even the non-dairy creamer used to make coffee taste delicious.
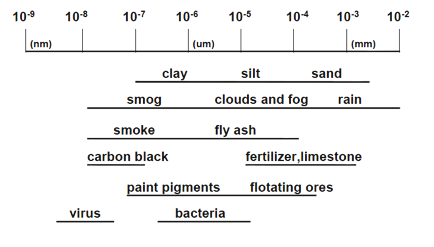
Figure 1.1. Dimension of industrial particles.
Particle Characterization and Counting is mainlyconcerned with studying particles in the size range shown in Figure 1.1. Within this size range, there are two properties that can distinguish particles from bulk materials:
A. In a system, there exist a high number of particles.Each individual particle may have different physical or chemical properties if the material is not homogeneous. The ensemble behavior is usually what is macroscopically observable. The macroscopic properties are derived from contributions of individual particles. If the relevant property is the same for all particles in the system, the system is deemed “monodisperse.” If all or some of the particles in the system have differing values for the property of interest, the system is referred to as “polydisperse.” Another term, “pausidisperse”is occasionally used to describe systems with a small number of distinct groups. All particles within a given group have the same value for the concerned property.
B. The specific surface area (surface area per unitmass) of small particles is so high that it leads to many significant and unique interfacial phenomena, such as surface interaction with the surrounding medium and neighboring particles.For example, a spherical particle with a densityof 2 g/cm3 will have a specific surface area of3 cm2/g when the diameter is one cm. The specific surface area increases to 3,000,000 cm2/g if the diameter is reduced to 10 nm. This example illustrates how a particle’s dimension determines the surface area, which in turn determines the thermodynamics and kinetic stability of a given particulate system.
The aforementioned surface property is especially unique for colloidal particles. The word colloid was coined by Thomas Graham in 1861 from Greek roots meaning ‘glue-like’, based on his observation that glue molecules do not pass through a parchment membrane.Thus, colloid science is based on the size of the colloidal unit. Many physical properties besides the one observed by Graham are shown by colloidal systems, that by definition, include systems with at least one dimensionless than a micron in size. Generally speaking, colloidal particles have dimensions from 10-9 m to 10-6 m.
Particles and Our Society
In the above matrix, colloidal suspensions, aerosols and emulsions are prevalent in many fields and have the largest application in industry or academia. The following is just a short list of fields involved with particulate systems:
- Abrasives
- Beer Industry
- Biomedical
- Biotechnology
- Cell Biology
- Chemical Mechanical Planarization
- Chromatographic Material
- Clays
- Cosmetics
- Cryobiology
- Crystals
- Electronic Industry
- Emulsion
- Environmental
- Filtration and Filter Efficiency
- Fish Farming
- Food Industry
- Fuel
- Hydraulic Fluids
- Lubricants
- Marine Biology
- Medical Imaging
- Metals
- Nanotechnology
- Paints and Pigments
- Paper Industry
- Pesticides
- Petrochemical Industry
- Pharmaceuticals
- Photo Industry
- Oils
- Toners
- Water Contamination
Particle technologies are deeply embedded in our society.Not only are they used as analytical tools in many industries for quality and process control, but they are also extremely useful in some not so obvious areas, like the environmental industry for waste disposal, pollution prevention and emission monitoring. New industries, like biotechnology,are increasingly using particle characterization analyses in both research and production processes.
Characterization of Particulate Systems
One focus area in particle science and technology is the characterization of particles’ size and concentration. The behavior of a particulate system and many of its physical parameters are highly dependent on the size and number of particles present in the system.
Out of necessity, there are many techniques used in particle characterization, especially since the sizes (from nanometers to millimeters) and shapes (from solid spheres to porous flat plates) are extremely broad. Prior to modern particle characterization technologies, the only evaluation methods available were physical separation methods such as sieving, which can only be used for particles larger than a few tens of microns. Additionally, classical separation methods are usually only able to bin particles into several sizes; this results in very low resolution. Optical microscopy may be the only exception to this since it is a method that provides visual observation of individual particles with dimensions down to the micron range. With optical microscopy though, a few dozen observed particles are tenuously used to extrapolate the properties of billions to trillions of particles in solution. Today, many new,sophisticated technologies are available that may be employed in particle characterization.
How We Define the Size of a Particle
For a 3D nonspherical or non-cubic particle, we will need more than one parameter to describe its dimension. The question is: “Can we choose just a few dimensional numbers to describe a particle?” The answer is “yes” for objects with regular shapes such as rectangles (two- or three-dimensional numbers) or a cylinder (two-dimensional numbers). However, for irregularly shaped particles that are often encountered in the real world, the dimensions cannot be completely described using just a few parameters. If we are dealing with just a few particles, then it might be possible—although difficult—to obtain all the numbers necessary to characterize the dimensions of the particles. When talking about millions of particles though, the ability to describe them individually is not practical. Only one number should be used to characterize each particle, and this number is size. The definition we employ to define size will affect the sizing data we obtain. One may assume that there is only one way to define size; in fact, there are many different definitions for using a single size to describe 3D irregularly shaped particles. The most common size definition is to use an equivalent spherical representation—since a sphere is a 3D object requiring only one number (diameter) to completely describe the size. If all the dimensional information of the particle is condensed into a single number, one must keep in mind that this single number will inherently contain distorted or summarized information about the particle, with the degree of distortion being related to the particle’s shape. There are many different methods for converting the size of 3D irregularly shaped particles into equivalent spheres. To follow are just a few definitions that often appear in the literature:
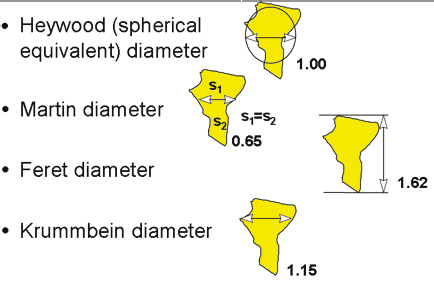
Figure 1.2. Different definitions of size
In addition, there are:
• Sphere of same maximum length
• Sphere of same minimum length
• Sphere of same weight
• Sphere of same volume (Heywood diameter)
• Sphere of same surface area
• Sphere of same sieve aperture
• Sphere of same sedimentation rate
The volume equivalent sphere (the Heywood diameter)is the one used in most particle sizing technologies. One-important thing to understand is that the method used to measure 3D irregularly shaped particles will affect the results when reporting on an equivalent spherical diameter. The spherical diameter distribution or the average diameter obtained using different technologies will have different bias and deviation from the actual, true equivalent diameters of the particles, because of both shape sensitivity of the technology and weighting effect for different particles in the sample. One technique may see more of the large particles while another technique may see more of the small particles. Which result is right?
Which Technology Produces the Correct Results?
The nature of each particle characterization technique will determine how they “see” the same system, with different views for different techniques. In the language of statistics, different techniques see particles with different “weighting factors.” The mean value obtained from summarizing discrete individual values represents the relationship between the measured signal and the particle.
It is very important to discuss what the differences are when using different technologies to obtain particle size.If we use an electron microscope to measure particles,we will measure the diameters, add them up, and divide by the number of particles to get a mean result. If wet hen use laser diffraction to obtain the particle size,we will see that the area of particles is what is most important, and the size mean data will be generated from multiple diffraction patterns of many particles at the same time. In the Coulter Principle (also known as the Electric Sensing Zone Method) measurement, we would get the volume of each individual particle and then the result reported as the Heywood diameter. Let us assume that there is a particle system that consists of four spherical particles with the diameters being 1, 2, 3 and 10 microns, respectively. The corresponding mean values from the various sizing techniques are shown in Table 1.2 and Figure 1.3.
Table 1.2. Various Particle Sizing Techniques

We can see from the previous table that the mean value can be quite different if we use different technologies. The difference between number-averaged value and weight-averaged value is due to the fact that in the number average, the mean value represents the values from particles with the largest population. In the weight average case, the mean value skews the representation toward the particles with the largest size. The same is true for the size distribution. Thus, we see that the number distribution and the weight distribution do not necessarily agree.\
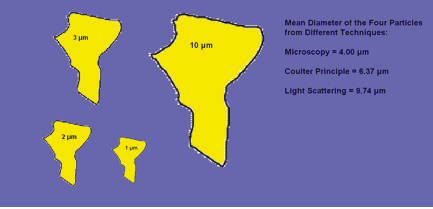
Figure 1.3. Various particle sizing techniques
Because of resolution limitation or practicality in actual measurements, the measured particle sizes are always classified into discrete channels (also called bins). Each channel covers a range of particle size. For example, if an instrument has 100 channels, and channels 10, 11, and 12 are marked 5 microns, 10 microns, and 15 microns respectively, then the particles classified into channel 11 will have diameters ranging from 7.5 to 12.5 microns.Even though the results may be presented as a continuous distribution curve, at a zoomed-in level, the results are a histogram with each channel centered at a nominal value with the high and low edges located in the middle of its nominal value and its neighboring channels’ nominal values.
From the above analysis, we know that in order to compare the results, the distribution obtained from different technologies must be converted to the same ground, i.e.,the same weighting. However, this conversion is based on an assumption that the technologies in question have the same sensitivity over the entire size range. Otherwise,the results will still be different even after conversion. For example, in laser diffraction measurements, the scattered intensity from large particles will be buried into the experimental noise and undetectable if the measurement is performed at large scattering angles; while in measurements relying on the Coulter Principle, the signals from small particles will be below the noise level if a large aperture is used. No matter what type of conversion is performed, the results from the two measurements will never be matched because there is different bias in the two technologies. One has to keep in mind that during the data transformation, the experimental error is also transformed. If in an electron microscopy measurement,there exists a ±3% error on the mean diameter, the error on the converted mass will be cubed and become ±27%! Contrastingly, if a ±3% uncertainty exists in a mass-based measurement, the uncertainty in the size would be only±1.5%. Another often-used conversion is from mass % to volume % or vice versa. In this conversion, if all particles have the same density, then the two distributions will have the same profile.
Data Interpretation
Many times there is confusion with the interpretation of the statistical data of a size distribution. The values for the mean, median and mode in many cases will be completely different depending upon which distribution one observes (volume or number). The question arises: “Why does this happen?” Which one is the correct one? It turns out either can be correct, depending on which kind of data offers the most relevant information for the given situation.
Suppose we have 200 ball bearings, 20 marbles, and 2 golf balls. If counted, the total number is 222. This means that the ball bearings are 90% of the total population, the marbles 9%, and the golf balls just 1%. But if we want to know the contribution in volume to the total, we have to measure the volume of all the different balls in the sample. In this case, the ball bearings contribute 25% to the total volume, the marbles 25%, and the golf balls 50% (see Figure 1.4).
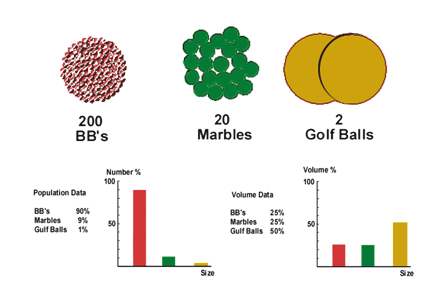
Figure 1.4. Number size distribution vs. volume size distribution.
When we look at the number size distribution graph, we are looking to the population of the particles. In general, most powder grinds have more fi nes than large pieces and thus the graph will have a tendency to shift toward the lower-end of the distribution (see Figure 1.5).
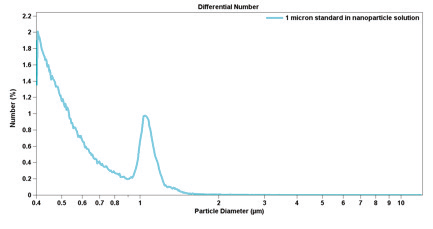
Figure 1.5. Number size distribution.
In a volume size distribution graph, since the larger particles have the most volume displacement, the curve will be skewed toward the larger sizes (see Figure 1.6).
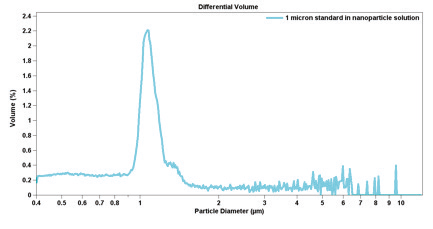
Figure 1.6. Volume size distribution.
The Coulter Principle
Background
While under contract to the United States Navy in the late 1940s, Wallace H. Coulter developed a method for counting and sizing particles. The method was initially developed to count blood cells, but soon emerged as a technique that could quickly and accurately count almost any type of particle. Its acceptance in the field of hematology is evident by the fact that presently, over 98% of automated blood cell counters incorporate the Coulter Principle. In the past 60 years, the method has also been utilized to characterize thousands of different biological and industrial materials. Bacteria, yeast cells, drugs, pigments, toners, foods, abrasives, explosives, clay, minerals,
metals, and many other materials have all been analyzed by the Coulter Principle. The method may be used to measure any particulate material that can be suspended in an electrolyte solution. Particles as small as 0.2 micron and as large as 1,600 microns in diameter can be analyzed by the Coulter Principle. The method is described in the International Standard ISO 13319 and is the subject of several ASTM standards. Over 100,000 references to the uses of the various COULTER COUNTER and Multisizer models have been documented.
The Coulter Principle
How Particles are Sized and Counted
The fundamental piece of the Coulter Principle is particles or cells passing through a “hole.” However, the hole must meet certain specifications. More precisely, the hole is an elongated glass tube. Within the glass tube, a finely bored ruby disk is embedded that constricts the flow of fluid through the glass tube while simultaneously constricting the current to a controlled value with little variation. In this course, we will refer to the glass tubes/ruby disks meeting these standards as “apertures.” If an aperture is placed between two electrodes and a current path is provided by a low concentration electrolyte, a resistance exists that can be measured between the electrodes.The aperture creates what is called a sensing zone. Particles in low concentration, suspended in the electrolyte, can be counted when passing through the aperture. As a particle passes through the aperture (see Figure 2.1), a volume of electrolyte-containing solution equivalent to the immersed volume of the particle is displaced from the sensing zone. This causes a short-term change in the impedance across the aperture. The resistance change can be measured as a voltage pulse or a current pulse. The voltage pulse is proportional to the volume of the sensed particle.
Using counter and pulse analyzer circuits, the number and volume of particles passing through the sensing zone can be measured. The volume may be represented as the equivalent spherical diameter. The measured particle sizes can be binned using a height analyzer circuit and a particle size distribution obtained. The electrical response of the instrument is essentially independent of the shape of particles with the same volume, though an exception to this may occur with some extreme shapes. Color, refractive index, and opacity of the particles do not affect the results.
Simple COULTER COUNTER systems may have only one counter and size level circuit; while more complex systems, like the Multisizer Series, can obtain particle size distributions automatically in up to 400 size channels. These measurements are made in only a few seconds, as counting and sizing rates of up to 10,000 particles per second can be achieved. The accuracy of these size measurements can be nearly perfect as particles are discretely counted and sized. To count the number of particles in a known volume of a suspension, such as for particulate contamination studies or a blood cell count, the same volume must be exactly known. A piston displacement metering system is currently used in recent models of the Multisizer and Z-Series instruments to obtain accurate volumes.
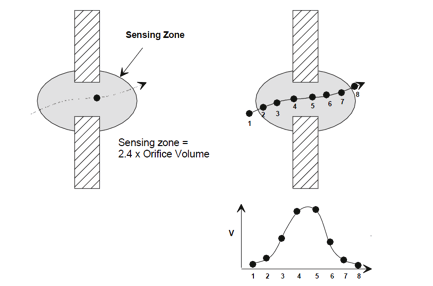
Figure 2.1. Pulse generation.
The Multisizer 4e is the latest generation of the COULTER COUNTER series (see Figure 2.2). It uses a Digital Pulse Processor (DPP) for high-speed digitalization of the signal, allowing the use of pulse area analysis and other techniques for additional particle characterization. The data does not have to be processed and compressed on the fl y, as in earlier versions of the system, but can be stored without loss of information. This enables the raw data to be reprocessed using different settings, as well as showing sample changes over the length of a run.
A peak begins when the signal rises above the noise threshold and ends when the signal falls below the noise threshold. The signal is scanned several million times per second and then the following information is extracted:
• Maximum Height
• Peak Width
• Mid-Height
• Maximum Height Gain Stage
Together, these parameters give a much better indication of the shape of the pulse than was available in the past— and make it possible to obtain a more accurate particle count and size distribution.
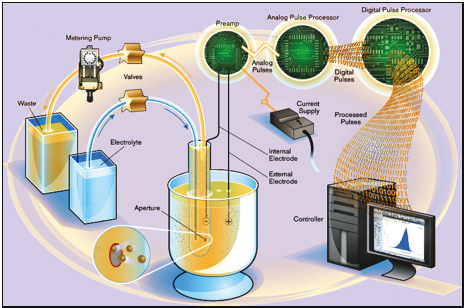
Figure 2.2. The Multisizer 4e Analyzer schematic.
Coincidence
The concentration of the particles to be measured should be sufficiently low, since they can be counted one at a time. However, depending on the volume of the sensing zone—and to a lesser degree, the response time of the electronics—two or more particles may be in the sensing zone at the same time. This gives rise to only one measured signal. This effect is called coincident particle passage. There are two effects in coincident events. Primary coincidence is as described above, where two particles are counted as one of a larger size (see Figure 2.3), which results in lower particle counts while having an effect on the size distribution as well. Secondary coincidence leads to an error in size distribution. Secondary coincidence occurs when two particles, both too small to be individually detected, are registered as one larger particle (see Figure 2.4). In Figures 2.5 and 2.6, the same sample was run under the same conditions but at different concentrations (A > B > C > D).The effect of coincidence on size distribution is only noticeable when the coincidence correction is above 30% to 40%. Primary coincidence up to 10% (where one particle in 10 is not being counted) is easily corrected mathematically; and is automatically performed by the Multisizer software. Primary coincidence correction is based upon the number of particles counted in the metered volume, the diameter of the aperture, and the empirical data related to the effective volume of the sensing zone.
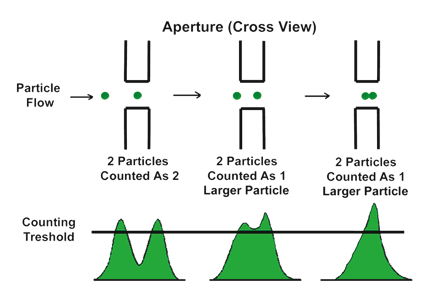
Figure 2.3. Effect of primary coincidence.
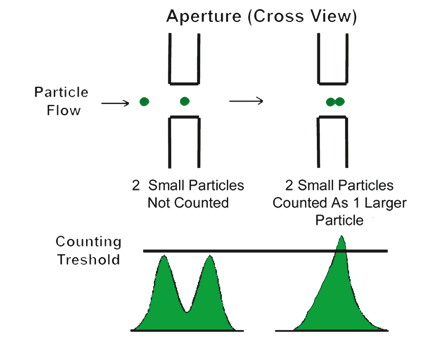
Figure 2.4. Effect of secondary coincidence.
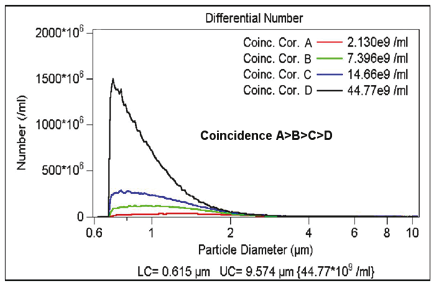
Figure 2.5. Effect of coincidence correction on counts.
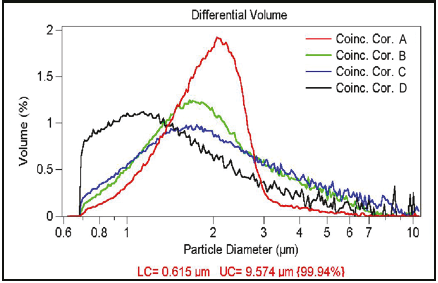
Figure 2.6. Effect of coincidence correction on the size distribution.
Counting and Coincidence Correction
At the noise threshold, the instantaneous concentration is measured for use by the concentration meter.This gives the user a means of checking the concentration of the sample.
At the count threshold, the number of pulses is counted using the same criterion as the peak data. Thus, the count should be equal to the number of pulses stored in the peak buffer—if the threshold was set equal to the count level. The mark and space counts at the count level are accumulated for the whole run. This information is used to coincidence-correct the size distribution. Typically, the count threshold would be set to the left-hand edge of the size distribution at the start of the run. The noise threshold can then be set at a lower level to allow collection of peak data below the count level, without reducing the accuracy of the coincidence-correction above the count threshold.
Particle Path Through the Aperture:
Pulse-Edit Function
When particles are drawn through the aperture, they come from all angles around the aperture. Some particles will pass directly through the center of the aperture, while other particles will pass through nearer to the edge of the aperture. All particles passing through the aperture will displace a volume of electrolyte solution and generate a voltage peak. However, those particles that do not pass through the center of the aperture will produce a slightly larger peak than would be expected for their displaced volume. This slightly larger “artifact” pulse causes the particle size distribution to be skewed ever-so-slightly to the larger sizes (see Figure 2.7).
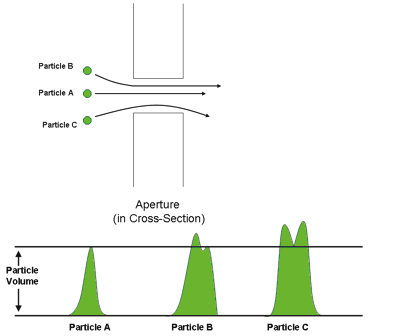
Figure 2.7. Pulse shape depends on the particle flow through the aperture.
The fluid velocity (directly related to the particle velocity) also plays a role in the distribution of the particle size. At the aperture walls, the velocity is lower, producing pulses that are wider and higher in amplitude. The high, wide pulses cause the size distribution to be skewed toward the larger sizes (see Figure 2.8). These effects are most significant and noticeable on very narrow size distribution materials; the artifact peak can manifest itself as what appears to be a second size population. On wider-size distribution materials, such as most powders and suspensions, this effect is neither significant nor observable.
Many of these artifact peaks can be electronically screened by examining each pulse, and “editing” unwanted pulses out of the analysis data.The use of the Pulse-Edit function removes the distorted pulses so that the recovered size distribution is more correct (see Figure 2.9). Typically, up to 50% of the particle-generated pulses are discarded in order to enhance the sizing accuracy.
To gain the most benefit from the Pulse-Edit function:
- The aperture tube used should be in the range of 10 to 280 microns in diameter.
- The particle size distribution to be measured should be unimodal—not exceeding approximately 2:1 by diameter in overall range—and lie at a modal diameter which is less than approximately 15% of the aperture diameter to be used (i.e., nodal diameter less than 30 microns for a 200-micron aperture).
- The concentration of the particles should be less than 10% aperture coincidence level.
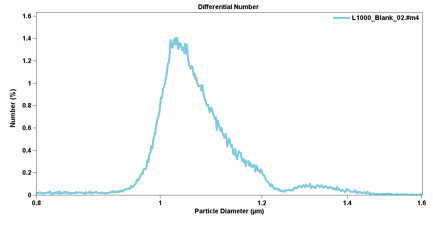
Figure 2.8. Size distribution of one-micron standard beads not using the Pulse-Edit function.
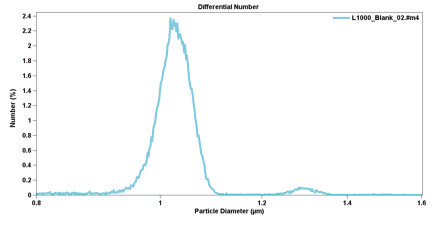
Figure 2.9. Size distribution of one-micron standard beads using the Pulse-Edit function.
Enhanced Editing
The use of a longer tunnel aperture may improve the accuracy of the results for samples with a narrow size distribution. The behavior of long tunnel apertures is mostly due to the greater approach to parabolic flow inside the bore (see Figure 2.10). True parabolic (streamline) flow is never reached in any usable aperture, because pipes need to be at least 100 times longer than their diameter for this type of flow to develop properly.
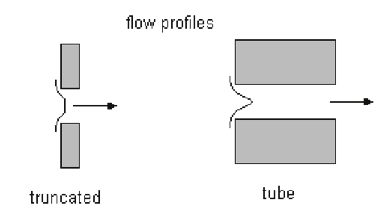
Figure 2.10. Cross section of a standard aperture and a long tunnel aperture tube.
When liquid flows in a streamline along a tunnel, the bulk of the liquid flows along a periphery at 0.7 R from the axis, where R is the radius of the tunnel. The fastest streamline is at the center (see Figure 2.11). Hydrodynamic forces tend to move particles toward the fastest flow; this is because, for real particles, the velocity across their diameter varies. Particles try to embed themselves in the average flow velocity, and the average velocity is always half the peak or central velocity. Long tunnels allow more particles to be embedded in this flow than ordinary short apertures do. However, because of the larger volume of such apertures, the apertures have a more restricted dynamic range and appear noisier with particles at 2% of their diameter; standard aperture tubes offset this effect. The 2% level is a higher size because the aperture volume is larger, as well.
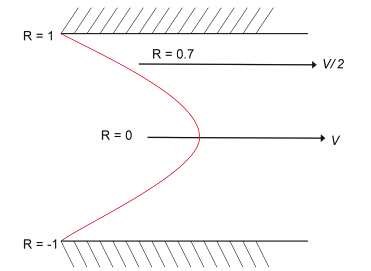
Figure 2.11. Velocity profile in parabolic flow.
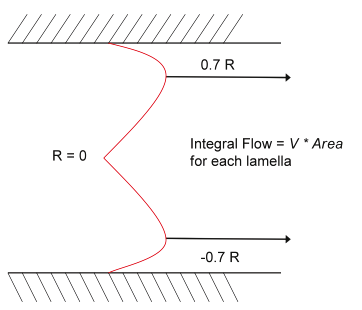
Figure 2.12. Bulk flow profile for parabolic flow in a tube with circular cross section. The highest concentration of particles is along the line marked 0.7 R.
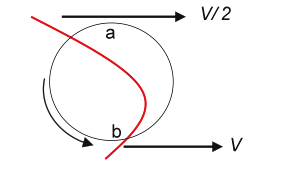
Figure 2.13. Hydrodynamic forces on a particle in parabolic flow.
The flow in a cylindrical tunnel can be imagined as a series of concentric cylinders each travelling at a velocity that follows the parabolic profile in Figure 2.11. The bulk fluid flow will be in the area of each cylinder multiplied by its velocity. The result has the profile shown in Figure 2.12. Particles are embedded randomly at a uniform concentration in all the cylinders, but the number of particles per second recorded by a counter will be greatest in the cylinders with the highest bulk flow. So, the particle flow rate has the same profile as the fluid bulk flow, as shown in Figure 2.12.
In Figure 2.13, because point a on the particle is travelling at V/2 and point b is travelling twice as fast, there must be a rotational force on the particle. Also, there must be a net force roughly tangential to the parabola tending to move the particle toward the faster streamline at V.
Figure 2.12 shows the bulk flow of liquid at 0.7 R, where the majority of particles are travelling at this streamline. In a short tunnel, particles close to the wall have too little time to move toward 0.7 R; whereas in a longer tunnel, the time to migrate increases. Consequently, longer tunnels give a greater proportion of pulses in the main peak. Pulses from 0.7 R to 0.0 R have essentially bell-shaped pulses; whereas those from the wall have “M” shapes resulting from the particles crossing regions of high-current density at both the entrance and exit of the aperture.
Edit circuits work on the width W of pulses relative to their heights H. Longer tunnels stretch pulse-widths out. Because parabolic flow is more established in longer tunnels, the pulses from particles near the wall of the aperture are much more stretched-out than pulses coming from particles in the 0.7 R streamline.
Longer tunnels also decrease pulse heights; the ratio W/H changes linearly with the square of the tunnel length change. Importantly, edit circuits have a much better opportunity to discriminate pulses.
Aperture tubes with a longer tunnel for use in the Multisizer 4e are manufactured in 50-micron, 70-micron, 100-micron, 140-micron, and 200-micron sizes; they are called High Resolution Aperture Tubes.
Particle Sizing Response
For an aperture with length- to-diameter ratio of approximately 1:1 or 2:1, the electrical signal will depend on both particle and aperture parameters.
Pv * r = i / I
- Pv = Particle Volume
- I = Aperture Current
- i = Pulse Intensity
r = A response factor relative to pulse height per unit volume V
r = (i / I) / Pv
V = Pv / (i / I)
Pv = V * (i / I)
V=1/R
V = 0.4852 * U2 * (L + 0.93 * U)
- U = D1.0556
- D = Aperture Diameter
- L = Aperture Length
The voltage response is guaranteed to be linear for particle diameters between 2% and 60% of the aperture diameter. Experiments have shown linearity response up to 80% of the aperture diameter, which can be accessed when the Multisizer 4e is run in extended range mode. When particles have diameter less than 2% of the aperture diameter, the noise dramatically increases.
Calibration
The Coulter Principle provides two basic measurements: particle count and particle volume. The particle count requires no calibration. The principle yields particle counts that can be regarded as completely accurate, subject to coincidence correction. However, the particle size response must be calibrated.
The ideal method of calibration is the mass integration, sometimes called the mass balance. The method is dependent upon using calibration materials that are of uniform density. The particles to be measured are used to calibrate materials that are of uniform density—and to calibrate the instrument using standard gravimetric and volumetric methods. The Kd (diameter calibration factor) can be calculated from the following equation:
Kd = [ ( 6 * W * Vp ) / ( Π* VT * ρ * (Δn * V ) ) ]1/3 * 104
- W = Mass of sample in beaker (grams)
- VT = Volume of electrolyte solution in which W is diluted (mL)
- Vp = Pump Volume (mL)
- ρ = Immersed density of the particles (g/mL)
- n = Number of particles in the size interval
- V = Arithmetic mean volume for that particular size interval (e.g., product of threshold value, aperture current, and attenuation)
Not all particulate materials are homogeneous in terms of density. For this reason, and for general convenience, it is more common to perform a calibration using standard materials, such as a polymer latex sample. Calibration standards that are NIST traceable can be obtained from Beckman Coulter, Inc. These are narrow-size-ranged latex samples whose size has been precisely measured by orthogonal methods, and the samples are standardized for the mode value. The material is measured and the mode of the generated size distribution is related to the assayed value of that latex standard, where:

- J = Number of Channels Selected
- I = Current (μA)
- G = Gain
- D = Calibrator Size (μm)
- X = Modal Channel, Left Edge (μm)
Regardless of the method of calibration, the calibration will only be valid for the entire range of size measurements from an aperture/electrolyte combination. Calibration drift is not common, but good laboratory practice dictates that routine calibration verification control tests be performed.
The Multisizer 4e provides automatic calibration and verification. This feature ensures that instrument calibration is uniform independent of operators, shifts, or different locations.
Table 2.1. Particle Size Ranges with Standard Tubes.
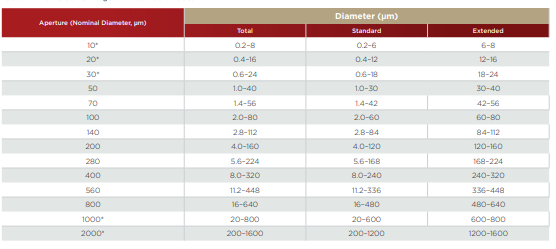
*Depends on system cleanliness and environmental electrical noise. **Depends on sample density
Apertures
Aperture diameter for standard tubes ranges from 10 microns to 2,000 microns. Each aperture can be used to measure particles within a size range of 2% to 60% of its nominal diameter, with the option for extended range for all apertures going up to 80% (See Table 2.1). Therefore, an overall particle size range of 0.2 micron to 1,600 microns is possible. The ability of the method to analyze particles is limited to those particles that can be suitably suspended in an electrolyte solution. The upper limit is sample dependent because of this—for sand, the upper limit may be 500 microns, but for tungsten carbide particles, the upper limit may only be 75 microns. The lower size limit is restricted by electronic noise (known as Johnson noise) generated mainly within the aperture itself. The following table lists the measurable particle size ranges for standard aperture diameters.
Selecting the most suitable aperture size is dependent upon the particles to be measured. If the sample to be measured is composed of particles largely within a 30:1 diameter size range, then the most suitable aperture can easily be chosen. For example, a 30-micron aperture can measure particles from roughly 0.6 to 24 microns in diameter, while a 140-micron aperture can safely measure particles from ~2.8 microns to 112 microns.
If the particles in the sample cover a wider range than a single aperture can measure, two or more apertures will need to be used, and the test results overlapped in the software, to provide a complete particle size distribution analysis.
Another consideration regarding smaller apertures is that they are more prone to occlusion due to debris in the sample suspension or agglomeration of the sample itself. With the Multisizer instruments, the aperture is monitored for blockage throughout the run, and a warning will display if a blockage is detected. An oscilloscope also displays the voltage pulses during the run, making aperture blockages more apparent and providing the user with a warning in case the aperture is close to being blocked. Blockages are normally very easily cleared by means of momentary back pressure from the instrument to the aperture, or by using a soft brush. Instruments for blood cell counting incorporate a “burn” circuit, which operates by applying high current to the aperture.This should cause the occlusion to be completely removed. If the above methods do not remove the blockage, the aperture tube can be removed from the system and cleared by soaking in acid or application of greater back pressure. When using small apertures, special care has to be taken with high current because damage can occur.
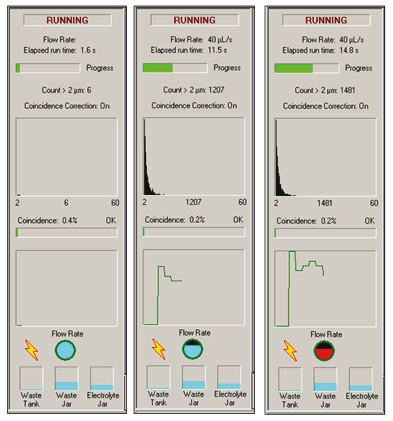
Figure 2.14. Electronic blockage detection
Extended Range Option
The Multisizer 4e is capable of measuring particles in the range of 2% to 80% of the aperture diameter, and in the range of 10% to 80% of the aperture diameter for a 2,000-μm aperture tube. The standard range is 2% to 60%—an extended dynamic range of 60% to 80% is available to examine broad distributions that extend above the 60% threshold. This feature is intended for examining particles in the small “tail” of a distribution that extends above 60%. For best results and to minimize blockage, it is recommended to use a larger aperture size for samples that contain a significant concentration of particles above 60% of the aperture diameter.
A 60% to 80% run uses special SOM settings, which override some parameters that the user may have set, such as aperture current and sizing threshold. To obtain results for larger particles using customized settings, select a larger aperture tube.
Aperture blockage is common when sample diameters are larger than 60% of the aperture diameter. The extended dynamic range should only be used for low concentrations of spherical particles larger than 60%. For best results, it is recommended to use a larger aperture size for samples that contain a signifi cant concentration of particles above 60% of the aperture diameter.

Figure 2.15. Graphical view of the extended range.
Electrolytes
Several considerations come into play when selecting the electrolyte in which the particles are to be suspended. The solution should be chemically compatible with the sample material and should allow for proper sample dispersion. Frequently, addition of surfactants and ultrasonication are necessary.
The solution must also be essentially free of particles within the measurement range of the sample. The electrolyte solution is commonly filtered using a 0.45-micron or 0.22-micron membrane filter.
Electrically, the solution should have roughly the same characteristics as a 0.2–20% w/v sodium chloride in water solution. The aperture resistance measured in the solution should be between one and 100 kΩ, ideally around 5–40 kΩ. As the Coulter Principle was initially used for counting blood cells, the electrolyte most often used is normal saline buffer (0.9 grams NaCl/100 mL H2O). A 5% trisodium orthophosphate solution is also commonly used, particularly when measuring clays, silicas, or other minerals where chloride ions inhibit dispersion. A list of common electrolyte solutions used in COULTER COUNTER applications can be found online at the particle.com or beckmancoulter.com websites.
As has been stated before, the Coulter Principle can be used to count and size any particles that can be suspended in an electrolyte. In order to suspend some larger particles, it may be necessary to add a thickening agent such as glycerol or sucrose to raise the viscosity and density of the solution. A thickening agent will also help reduce the noise generated by the turbulent flow of low viscosity electrolyte solutions as they pass through large diameter apertures (d > 560 microns). Even with maximum stirring and with thickening agents, large particles may not stay in suspension uniformly enough to enable a representative sample to be counted with reproducible results. It is because of the issue of particle suspension that round-bottom beakers have virtually replaced flat-bottom beakers as the vessel of choice with Coulter Principle measurements.
Conductive Particles and Porous Particles
In theory, only some difference in conductivity is needed to generate a pulse; but in practice, the discharge potential from conductor to ions (the reversible electromagnetic fi eld) creates a barrier that makes any conductor into a non-conductor—provided the potential across the particle does not exceed the discharge potential. The voltage necessary to break the potential barrier is known as the breakdown voltage.
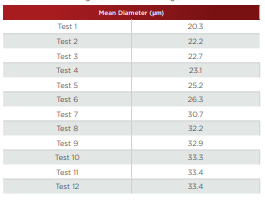
Particles of conductive materials can be accurately measured by the Coulter Principle, provided that the voltage applied across the aperture does not exceed the breakdown voltage. To analyze a conductive material, an initial test should be performed in order to get the optimum current that may be applied below the breakdown voltage (see Figure 2.16 and Table 2.2). For the fi rst run, the current and gain are automatically set up by the instrument. Then a series of runs are performed, decreasing the current in each consecutive run.The mean size will increase, until reaching a point where it plateaus. The point of plateau is when the applied current drops below the breakdown voltage.
Particles of highly conductive materials which do not easily form surface layers—such as copper, silver, and platinum—can be sized correctly, provided a very low voltage is used and the barrier is increased, i.e., by adding a 0.5% solution of Cetrimide.
In the case of cells enclosed by membranes, the linear response to cell volume changes at some “breakdown” value of applied voltage. This value has to be taken into account when setting conditions for the analysis. Blood cell analyzers are designed to operate below the blood cells breakdown potential.
When a particle contains pores, the influence of particle porosity should be determined experimentally. For porous particles, the volume of pores that are parallel to the electric fi eld lines is not measured, while the volume of pores perpendicular to these lines does contribute to the measured volume.
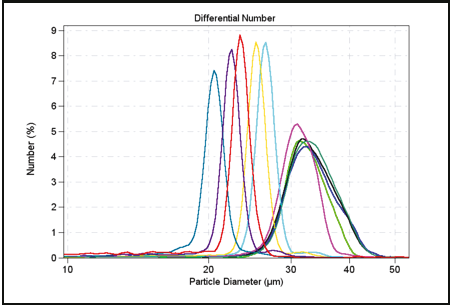
Figure 2.16. Determining the breakdown voltage.
Table 2.2. Determining the Breakdown Voltage.
In practice, the situation is far more complicated. The directions of the pores in a particle are randomly distributed in most cases, and the pores: (1) may be interconnected; (2) may pass through the whole particle or not; and (3) may vary in size from less than one nm up to several microns—meaning that not all pores may be wetted by the electrolyte. The only way to determine the infl uence of porosity is to measure a particle twice— fi rst with open pores, and then again with all pores fi lled or closed with an inert medium. When the porosity of a particle is known, its infl uence on the measured size may readily be established.
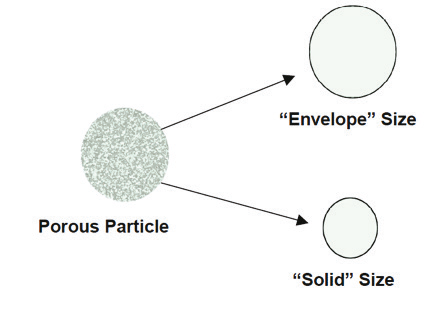
Figure 2.17. Two “different” sizes for a porous particle.
Particles with interconnected pores produce a size related to their solid volume—not to their “envelope” volume (see Figure 2.17). The electrolyte is able to fi ll the pores, allowing the current to pass through the particles and thus produce smaller pulses from the aperture.There are several techniques to solve this problem, based on the ability to fi ll the pores with an organic substance (usually a solvent), which is solid at room temperature. For exploratory analysis, an initial assessment of the “envelope” size may be achieved by other methods, i.e., microscopy. In this manner, a correction factor can be obtained and, by entering this factor in the software, it will correct the results to yield the “envelope” size instead of the “solid” size. In quality control, it is not important to know the envelope size. The specifi cation of the product can refer to the solid size—and for practical purposes, it will make no difference.
Measurement Precision
In order to achieve maximum measurement precision, there are two potentially competing factors that must be considered. First, the total number of particles counted must be sufficiently high; and second, the concentration of particles must be such that coincidence limitations are not exceeded. In other words, ideal counting conditions exist with large measurement volumes of low particle concentration. Generally, these conditions are neither practical nor are they necessarily achievable. It is, however, important that any particle counter/sizer should measure a large number of particles in order to achieve the greatest statistical confidence possible for the result. When it is not possible to accumulate a large number of counts (i.e., when analyzing clean fluids), it is advisable to run the analysis in triplicate and use the mean value obtained from the three runs.
Table 3.1 presents precision statistics obtained from experimental data from 31 measurements of 10-micron latex particles.
Table 3.1. Precision of Particle Counts at Various Count Levels.

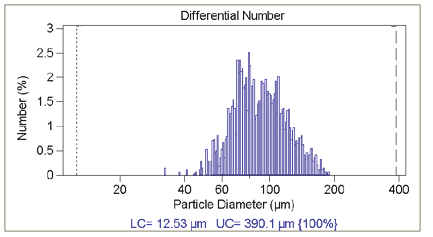
Figure 3.1. Few particle counts.
Good statistics are indicated when there is little raggedness in consecutive channels in the DIFF mode, in addition to there being an absence of a regular rise in the data in the largest channels in the DIFF VOL mode— indicating that only one particle has been found in each channel. Figure 3.1 illustrates this effect of insuffi cient particle counts; while Figure 3.2 displays the correct analysis after accumulating more data.
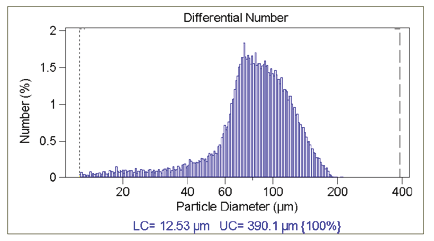
Figure 3.2. Correct analysis after accumulating more data.
Special Considerations for Using Small and Large Aperture
When using small apertures (10, 20, 30, and 50 microns) or large apertures (400, 560, 1,000 and 2,000 microns), special care has to be taken due to their particular characteristics.
Using Small Apertures (< 50 microns)
Typically, 800 μA should be regarded as the maximum working current. However, there exist circumstances where 1000 μA on a 30-micron aperture and 1600 μA on a 50-micron aperture will be acceptable. The aperture current should never exceed 800 μA with 10- and 20-micron apertures.
The salient point regarding small apertures is that the background count should be as low as possible, since the instrument is working near the limits of its capability. There are several sources of high background noise, as indicated in the information that follows.
Dirty Electrolyte Solution: This factor, which influences the successful use of small apertures more than any other factor, is the strength and cleanliness of the electrolyte solution. Filtration of the electrolyte solution is of extreme importance.
For most electrolyte solutions, increasing the salt concentration will increase signal to noise ratio at sizes below one micron.
For example, use 2–4% NaCl instead of 1% NaCl. Use 4–6% Na3PO4 instead of 2% Na3PO4.
It should be noted, however, that an increase in electrolyte solution concentration may have an adverse effect upon the material being analyzed, which should be examined.
When deciding upon the concentration of the electrolyte solution, it is best to keep in mind that one of the limiting factors is the aperture resistance. Ideally, the aperture resistance of all orifice tubes should be in the range of 1–100 kΩ.
Environmental Interference: It will be difficult to obtain any satisfactory counts if the instrument is located in a dusty environment. The instrument should preferably be kept in a reasonably dust-free room.
Electrical Interference: Any form of electrical interference will cause an increased background count. The most obvious symptom of electrical interference is noticed at the Concentration Index (C.I.); the C.I. will tend to increase its reading and may also be unsteady when electrical interference is present. Any deviation from the normal C.I. reading should be immediately obvious. Interference may be eliminated by moving the instrument to a different power supply or by installing a voltage conditioner to suppress electrical noise.
Stirrer Motor: Another source of noise can be the stirrer motor. When using the instrument at 2% of the aperture diameter, it may help to turn the motor off while performing the analysis. Small particles will not settle out during this short time.
Damaged Aperture Wafers: A further possible source of noise is the orifice tube itself; this will normally only show at the smallest size levels as variable noise on a blank electrolyte solution, where none had been present before. If the orifice tube is the cause, then the blank count will tend to differ considerably from one aperture current polarity to the other. Fit another orifice tube with the same aperture diameter into the stand, and repeat the test.
Excessive Aperture Current: Excessive current can cause the electrolyte solution in the aperture to heat, or even to boil, producing noise. The best practice is to reduce the current or to increase the conductivity of the electrolyte solution. Prolonged boiling will permanently damage the aperture wafer.
Non-Aqueous Electrolytes: When using organic solvents with low evaporation temperature, the current in the aperture may heat the solvent and cause electrical noise.This can be reduced by choosing a lower current setting and also by lowering the temperature of the electrolyte solution.
External Sound and Mechanical Vibration: With the higher current densities that are encountered with small apertures, the instrument can be affected by either vibration of the supporting bench or by local sounds of high intensity (banging, shouting, etc.). These should be eliminated during the analysis.
20-Micron and 10-Micron Aperture
When using the smallest apertures (10 and 20 microns) to measure particles with a diameter approaching the lower limit of the Multisizer 4e instrument (approximately 0.2 micron), all factors regarding the elimination of noise sources assume an even greater importance, and other factors are introduced. It is therefore recommended that the procedure adopted to measure these small diameters take the following points into consideration:
(a) The electrolyte solution should be membrane-filtered twice at 0.1 micron size cut-off and, where possible, should consist of a 4% saline solution or one of equivalent conductivity.
(b) Ensure that the aperture current never exceeds 800 μA. High currents can erode the aperture as well as generate electrical noise.
(c) Computer monitors should be positioned as far as is practically possible away from the Multisizer 4e instrument.
Using Large Apertures (> 400 microns)
Using normal electrolytes may cause turbulence in the fluid flow that can interfere with the analysis. Turbulence due to fast flow of low viscosity electrolyte solutions through the 2,000-, 1,000-, 800-, 560-, and occasionally, the 400-micron orifices can create an audible noise actually heard as a whistle, and can be picked up as electrical noise on the instrument. Increasing the viscosity or density of the electrolyte solution substantially overcomes this problem and helps also to suspend dense particles. Viscosity should not generally be higher than the equivalent of 70% glycerol (22.5 cP at 20° C); usually, a solution of 40% glycerol is sufficient.
The 400-micron aperture design and configuration produce a borderline case, i.e., some aperture tubes require the addition of glycerol to the electrolyte solution to prevent noise, while others function perfectly well with low viscosity electrolyte solutions (like ISOTON II diluent). It must be emphasized that nothing is physically wrong with a new 400-micron aperture tube that requires an electrolyte solution of increased viscosity. In fact, the addition of glycerol has a two-fold effect: (1) turbulent flow is reduced; and (2) simultaneously, the suspending of large, dense particles is facilitated.
The upper size limit obtainable with 1,000-micron and 2,000-micron aperture tubes is very dependent upon the density of the material being analyzed, and the practical upper limit of measurement is approximately 1,600 microns with particles of density ~1 g/ml.
CFR Part 11 Compliance
Electronic Signatures (21 CFR Part 11)
The Electronic Records and Electronic Signatures Rule (21 CFR Part 11) was established by the FDA to define the requirements for submitting documentation in electronic form and the criteria for approved electronic signatures. Organizations that choose to use electronic records to meet record-keeping requirements must comply with 21 CFR Part 11, which is intended to improve an organization’s quality control, while preserving the FDA’s charter to protect the public. Because analytical instrument systems such as the Multisizer 4e generate electronic records, these systems must comply with the Electronic Records Rule.
Electronic Records
Electronic record refers to any combination of text, graphics, data, audio, pictorial, or other information representation in digital form that is created, modified, maintained, archived, retrieved or distributed by a computer system. This definition applies to any digital computer file submitted to the agency, or any information not submitted but which is necessary to be maintained. Public docket no. 92S-0251 of the Federal Register (Vol. 62, No. 54) identifies the types of documents acceptable for submission in electronic form and where such
submissions may be made.
FDA Requirements
The Multisizer 4e control software has been designed to allow users to comply with the Electronic Records and Electronic Signatures Rule. Any organization deciding to employ electronic signatures must declare to the FDA their intention to do so.
The FDA ruling includes these guidelines:
- The agency emphasizes that these regulations do not require, but rather permit, the use of electronic records and signatures. (General comments section)
- The use of electronic records as well as their submissions to FDA is voluntary. (Introduction to final ruling)
- If electronic submissions are made:
Persons may use electronic records in lieu of paper records or electronic signatures in lieu of traditional signatures…. provided that: (1) The requirements of this part are met; and (2) The document or parts of a document to be submitted have been identified in public docket No. 92S-0251. (Section 11.2 Subpart A).
Section 11.3 Subpart A describes two classes of systems: closed and open. A closed system is one where system access is controlled by persons who are responsible for the content of electronic records. The people and organization responsible for creating and maintaining the information on the system are also responsible for operating and administering the system.
An open system is one where system access is not controlled by persons who are responsible for the content of electronic records.
A typical Multisizer 4e system can be regarded as a closed system.
Security Controls
A Multisizer 4e installation needs to have a procedure designed to ensure proper operation, maintenance and administration for system security and data integrity. Persons who interact with the system, from administrators to users, must abide by these procedures. Therefore, the ultimate responsibility is with the organization generating electronic records and signatures. The Multisizer 4e software is a component, albeit a vital one, of the overall process. The controls to be applied to a closed system are specified in Subpart B, Section 11.10.
Electronic Controls: The chief purpose of electronic controls is to ensure the authenticity, integrity, and, when
appropriate, the confidentiality of electronic records, and to
ensure that the signer cannot readily repudiate the signed record as not genuine. Many of the controls described in Section 11.10 refer to written procedures (SOPs) required by the agency for the purpose of data storage and retrieval, access control, training, accountability, documentation, record-keeping, and change control.
System Validation: Other controls are addressed either by the Multisizer 4e software itself, or in combination with end-user procedures. Most important is the validation of systems to ensure accuracy, reliability, consistent intended performance, and the ability to discern invalid or altered records [Section 11.10 Paragraph (a)]. The complete and overall validation of the system, as developed by the organization, ensures the integrity of the system and its data. The features of the Multisizer 4e software are designed to comply with the specifications of these regulations.
The Multisizer 4e software employs a system of usernames and passwords, consistent with the specifications of Subpart C, Section 11.300, to ensure that only authorized
individuals can use the system, electronically sign a record, access the operation or computer system input or output device, alter a record, or perform the operation at hand.
Audit Trail: The Multisizer 4e software performs data input and operational checks that determine, as
appropriate, the validity of the source of data input or
operational instruction, and enforce permitted sequencing of steps and events (Subpart B, Section 11.10). These two features ensure that, as much as possible, valid data are entered into the system, and all required steps have been completed to perform the task at hand.
The purpose of all such data checking and validation is
to allow the system to generate accurate and complete
copies of records in both human-readable and electronic
form suitable for inspection, review, and copying by the
agency [Section 11.10, Paragraph (b)]. The Multisizer 4e
software system is able to enforce strict procedures to
record all changes that are made to data generated using
the software [Section 11.10, Paragraph (e)].
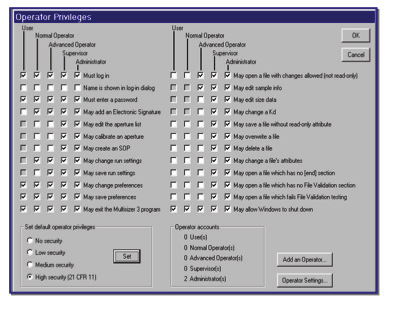
Figure 5.1. Security options in the Multisizer software.

